Thursday, October 15, 2020

Owner Suzana Davila said after giving her "heart and soul" to Cafe Poca Cosa over the years, she is choosing to shut her restaurant down after experiencing "many months of great anxiety" because of the pandemic's impact on the cost of operating an eating establishment with limited occupancy.
“Clearly, this is not how I imagined my business would culminate. I always envisioned passing the business on to my hardworking children who have been actively involved in the business for many years”, said Davila. “The continued threat of Covid to the restaurant and hospitality industry is ever-present. With fixed costs of doing business and rising food costs, along with restrictive seating limits, we just do not see a profitable way of continuing."
Originally located in a small space at Scott Avenue And Congress Street, Cafe Poca Cosa earned a name for itself serving fantastic Mexican culinary wonders that became a destination for foodies from around the world. Davilla, with her sisters Marcela and Sandra, helped put Tucson on the culinary map long before UNESCO came calling.
"I feel incredibly privileged to have been part of our wonderful downtown for all these years," Davilla said. "I would like to thank the people of Tucson for all the goodwill and assistance they have provided over the years."
Cafe Poca Cosa's sister restaurant, The Little One, remains open as a grab-and-go market with limited outdoor seating.
Monday, October 12, 2020

While Public Brewhouse offered a wide variety of beers from seasonal stouts to Sonoran sours, they also carved out a niche for themselves with trivia nights, board games and live music.
“Our name, Public, comes from the idea that a pub is a public house. We really wanted to create an environment people feel comfortable coming into," head brewer Mike Gura previously told the Tucson Weekly.
Shortly before the pandemic hit, Public Brewhouse expanded in February with a sister location, Public Taphouse at 6720 E. Camino Principal, which remains on COVID hiatus.
Wednesday, October 7, 2020
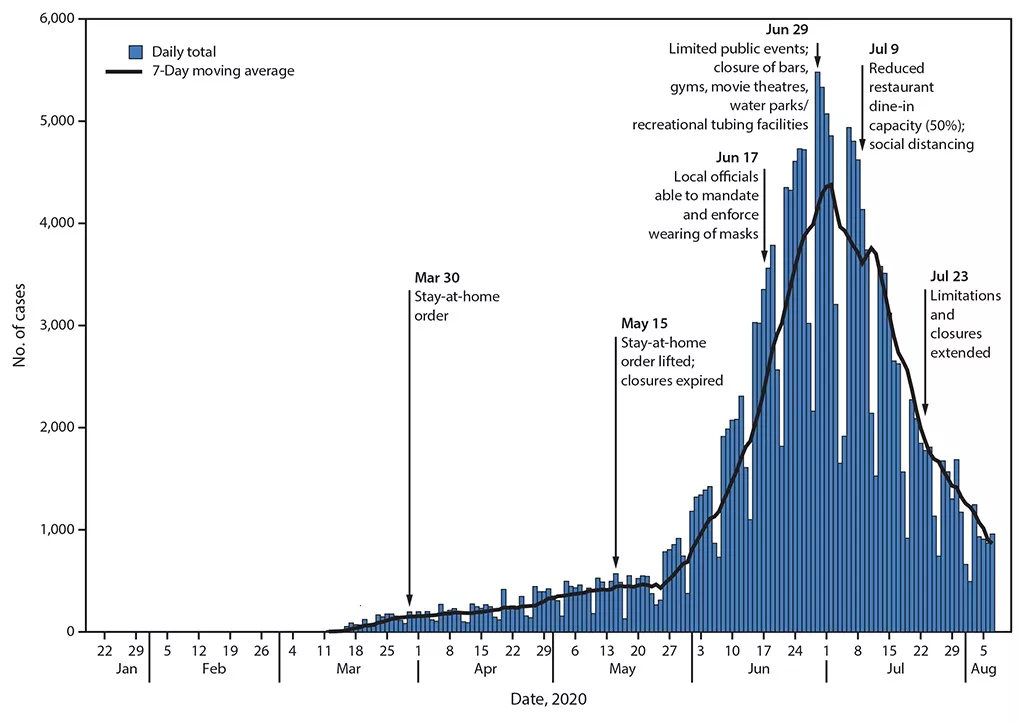
A new report from the Centers for Disease Control and Prevention examines how effective Arizona’s mitigation measures were on stopping the increase of COVID-19. The report, which tracked case numbers from Jan. 22 to Aug. 7, shows a clear correlation in reduced virus cases after face masks and social distancing were mandated.
In Arizona, the average number of daily virus cases increased approximately 151% after the statewide stay-at-home order was lifted in mid-May, with Gov. Doug Ducey declaring “we are clearly on the other side of this pandemic.”
According to CDC data, two weeks after Arizona's stay-at-home orders were first lifted on May 15, daily new COVID cases increased from 808 on June 1 to 2,026 on June 15. This led to a peak in cases from June 29 to July 2. Cases then began to reduce after Ducey allowed local officials to implement their own mandates on June 17. The ensuing local policies were applicable to approximately 85% of the total Arizona population.
COVID-19 cases then declined by approximately 75% following "sustained prevention efforts" across Arizona. These prevention efforts include wearing masks, limiting public events and closing certain businesses such as bars, movie theaters and gyms. Due to the infection cycle of the virus, case increases and reductions are delayed by an average of two weeks after mandates change.
The report states: The number of COVID-19 cases in Arizona stabilized and then decreased after sustained implementation and enforcement of statewide and locally enhanced mitigation measures, beginning approximately two weeks after implementation and enforcement of mask mandates and enhanced sanitation practices began on June 17; further decreases were observed during July 13–August 7, after statewide limitations and closures of certain services and businesses.
The CDC continues by saying that quantitative data on the effectiveness of community mitigation measures at suppressing the virus’ spread is difficult to calculate, and the primary goal of implementing these widespread “enhanced mitigation measures” in Arizona was to protect and save lives and maintain capacity in the health care system. Ultimately, a combination of voluntary and enforceable measures is more effective than any single measure, although public policy can effectively increase social distancing.
These mitigation measures should still be implemented, particularly before a vaccine or other treatments become widely available. State, local and tribal officials are best positioned to continually monitor data and collaborate to determine the level and types of enhanced mitigation required. Mitigation measures, including mask mandates, that are implemented and enforced statewide appear to have been effective in decreasing the spread of COVID-19 in Arizona.
Thursday, October 1, 2020
This makes 2020 the second driest monsoon since the weather records began in 1895. In fact, 2020 was only .03 inches from being the single driest monsoon ever, an honor that belongs to the 1924 monsoon, which saw 1.59 inches. 1924 and 2020 are also the only monsoons on record with less than 2 inches of rain.
On a monthly breakdown, June generally sees .15 inches, July sees 2.25 inches, August sees 2.39 inches, and September sees 1.29 inches. For 2020, June had no rain, July had .46 inches, August had 1.16 inches, and September had trace amounts.
Luckily, this weak summer rain is not a trend in recent years. While monsoon 2019 also saw below average rainfall, 2015 through 2018 all saw above-average monsoonal rains, with 2017 seeing nearly 50 percent more rain than average.
However, rainfall is only one part of the equation. August 2020 was also Tucson’s hottest month ever recorded since 1895, beating the previous record set by … July 2020. Both months combined to make this summer the hottest in all 125 years of weather records. According to NWS data, this August held a combined average temperature of 92 degrees. This July held a combined average of 91.5. Before these last two months, the hottest average month was July 2005 at nearly a full degree lower.
The average August temperature over the last 125 years is 84.7 degrees, and the average July temperature for the same range is 86.5. These temperatures are not daily highs, but averages over the entire month—highs and lows. And while these last two were the hottest months on average, the maximum temperature recorded on a single day in Tucson was in June 1990 at 117 degrees.
“The trend is for warmer," said John Glueck, senior forecaster for NWS Tucson. "We’ve had hotter summers for a good period of time now, and that’s something we’ll just have to get used to with a warming climate."
Thursday, September 17, 2020
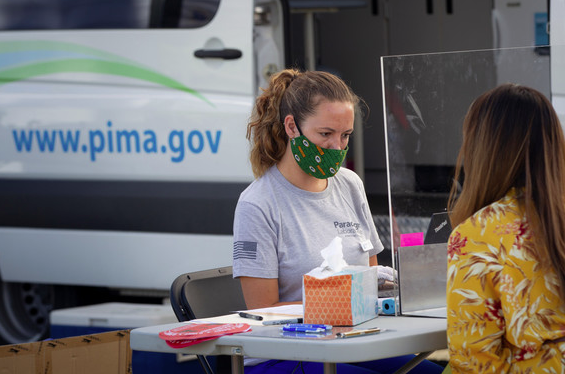
Today, the Pima County Health Department announced a partnership with the State and FEMA to offer "pop-up" testing at multiple locations around Tucson.
The tests are free, and while pre-registration is strongly encouraged, walk-ins can register on the spot. Preregistration is available at doineedacovid19test.com, and results are available in 3-5 days.
Below are locations and dates for pop-up testing:|
Location |
Date & Time |
|
United Community Health Center 1260 S. Campbell Rd. Green Valley. AZ 85614 |
9/17/2020 8 a.m.-12 p.m. |
|
Fourth Avenue 522 N. 4th Ave, Tucson AZ |
9/17/2020 7 p.m.- 10 p m. |
|
Dirtbags 1800 E Speedway Blvd, Tucson, AZ 85719 |
9/18/2020 7 p.m.-10 p.m. |
|
Green Valley Presbyterian Church 2800 S Camino Del Sol, Green Valley, AZ 85622 |
9/18/2020 8 a.m.-11 p.m. |
|
University Boulevard 825 E University Blvd #101, Tucson, AZ 85719 |
9/19/2020 7 p.m.-10 p.m. |
|
Green Valley Presbyterian Church 2800 S Camino Del Sol, Green Valley, AZ 85622 |
9/19/2020 8 a.m.-11 a.m. |
|
United Community Health Center 1260 S. Campbell Rd. Green Valley. AZ 85614 |
9/22/2020 8 a.m.-12 p.m. |
|
Fourth Avenue 522 N. 4th Ave, Tucson AZ |
9/24/2020 7 p.m.-10 p.m. |
|
University Boulevard 825 E University Blvd #101, Tucson, AZ 85719 |
9/24/2020 7. p.m.-10 p.m. |
Thursday, September 10, 2020
Wednesday, September 9, 2020
Both months combined to make this summer Tucson's hottest in all 125 years of weather records. According to data collected by NWS, this August held a combined average temperature of 92 degrees. This July held a combined average of 91.5 degrees. Before these last two months, the hottest monthly average was in July 2005 at nearly a full degree lower.
The average August temperature over the last 125 years is 84.7 degrees, and the average July temperature for the same range is 86.5. These temperatures are not daily highs, but averages over the entire month—highs and lows.And while these last two were the hottest months on average, the maximum temperature recorded in Tucson was in June 1990 at 117 degrees.
Tuesday, September 8, 2020

Longtime Western attraction and film location Old Tucson announced today it will remain closed indefinitely due to the continued impact of COVID-19. According to an announcement, Pima County, which owns and leases the park to a private operator, will assume responsibility of Old Tucson starting next week, and will begin working on a new plan for the park’s future.
“The decision to close Old Tucson indefinitely due to COVID-19 was made with a heavy heart. We know how important Old Tucson is to our community, guests and employees,” said Terry Verhage, general manager of Old Tucson. “We did everything possible to keep our loyal fans safe when we were open, but the ongoing COVID-19 public health protocols and restrictions limited park attendance to the point where Old Tucson could no longer stay in business.”
Pima County's Attractions and Tourism Office is seeking ideas from potential operators and lessors about what Old Tucson could be in the future. This is not the first time Old Tucson has "closed indefinitely" however, as the attraction closed for roughly two years following a devastating fire in 1995.
“Old Tucson has provided thousands of jobs and entertained millions of guests over the decades. If not for the COVID-19 pandemic, Old Tucson would still be in business,” Verhage said.
Thursday, August 27, 2020

New York is allowing residents from five states—including Arizona— to visit the Tri-State region without needing to quarantine for 14 days after arriving.
Alaska, Deleware, Montana and Maryland were also taken off New York's COVID-19 travel advisory by New York Governor Andrew Cuomo last Tuesday. Guam, however, was added to the list.
"New York State is moving forward in the face of a continuing crisis throughout the nation and around the world," Cuomo said. 'We've gone from one of the nation's worst infection rates to one of its best and have an infection rate below one percent for the 11th straight day, but that's no excuse for getting complacent as we add two more states to our travel advisory."
Under the advisory, travelers from areas with a positive COVID test rate above 10 percent of 100,000 people over a seven-day average must submit a form with their travel information and quarantine for two-weeks upon arrival or face a $2,000 fine. While bordering states New Jersey and Connecticut have the same travel restrictions in place, they do not have the stiff monetary penalty.
The advisory applies those who travel by plane, bus, train or boat. The restrictions do not apply for those traveling through the Tri-State region for business reasons.
Gov. Cuomo first implemented the travel advisory restrictions to New York on June 25.
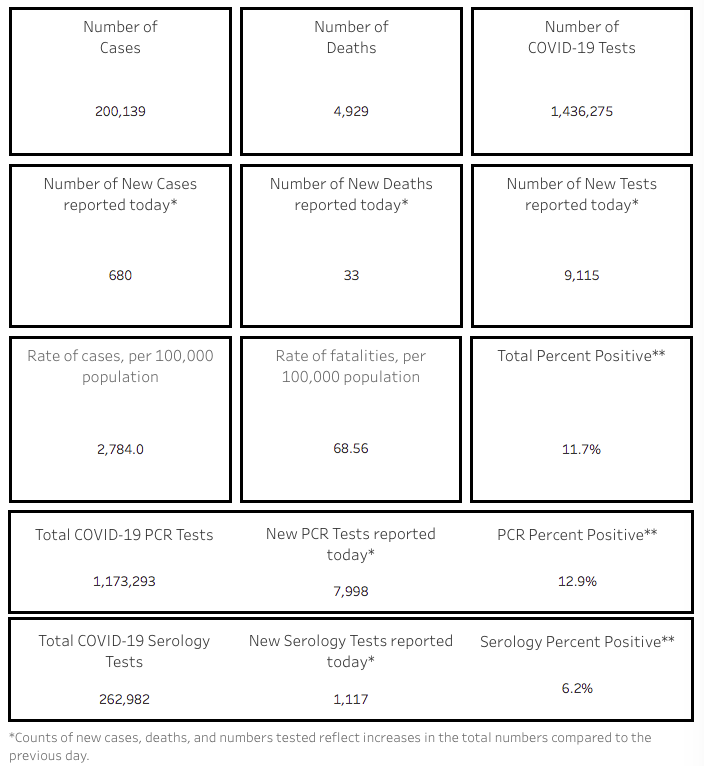
Pima County had seen 21,001 of the state’s 200,139 confirmed cases.

With 33 new deaths reported today, a total of 4,929 Arizonans had died after contracting COVID-19, according to the Aug. 27 report.
The number of hospitalized COVID cases continues to decline. ADHS reported that as of Aug. 26, 895 COVID patients were hospitalized in the state, the lowest that number has been since May 25, when 818 people were hospitalized. That number peaked at 3,517 on July 13.
A total of 1,019 people visited ERs on Aug. 26 with COVID symptoms. That number peaked at 2,008 on July 7 and has bounced between 900 and 1,100 for most of August.
A total of 311 COVID-19 patients were in intensive care unit beds on Aug. 26. That number has been cut in half since the beginning of August. The number in ICUs peaked at 970 on July 13.
In Pima County, the week-by-week counting of cases peaked the week ending July 4 with 2,398 cases, according to an Aug. 19 report from the Pima County Health Department. Those numbers have dropped with Pima County requiring the wearing of masks in public but they have plateaued in recent weeks, with 832 cases in the week ending Aug. 8 and 819 cases in the week ending Aug. 15. (Not all recent cases may have been reported.)
Deaths in Pima County are down from a peak of 54 in the week ending July 4 to 19 for the week ending Aug. 8.
Hospitalization peaked the week ending July 18 with 247 COVID patients admitted to Pima County hospitals. For the week ending Aug. 8, 88 COVID patients were admitted to Pima County hospitals.
State hitting benchmark to allow shuttered biz to reopen
State officials expect Arizona to hit certain benchmarks allowing for the reopening of Indoor gyms, movie theaters, bars serving food, water parks and tubing operations in Pima, Maricopa and Pinal counties.
State metrics are expected to reach the “moderate” COVID-19 transmission category today.